Boardex Report Case Study:
The examples in the case study are community graphs of the Boardex database of ‘who-knows-who’ executives around the planet.
The Boardex case study analyses several million executives; and 30+ million links between executives.
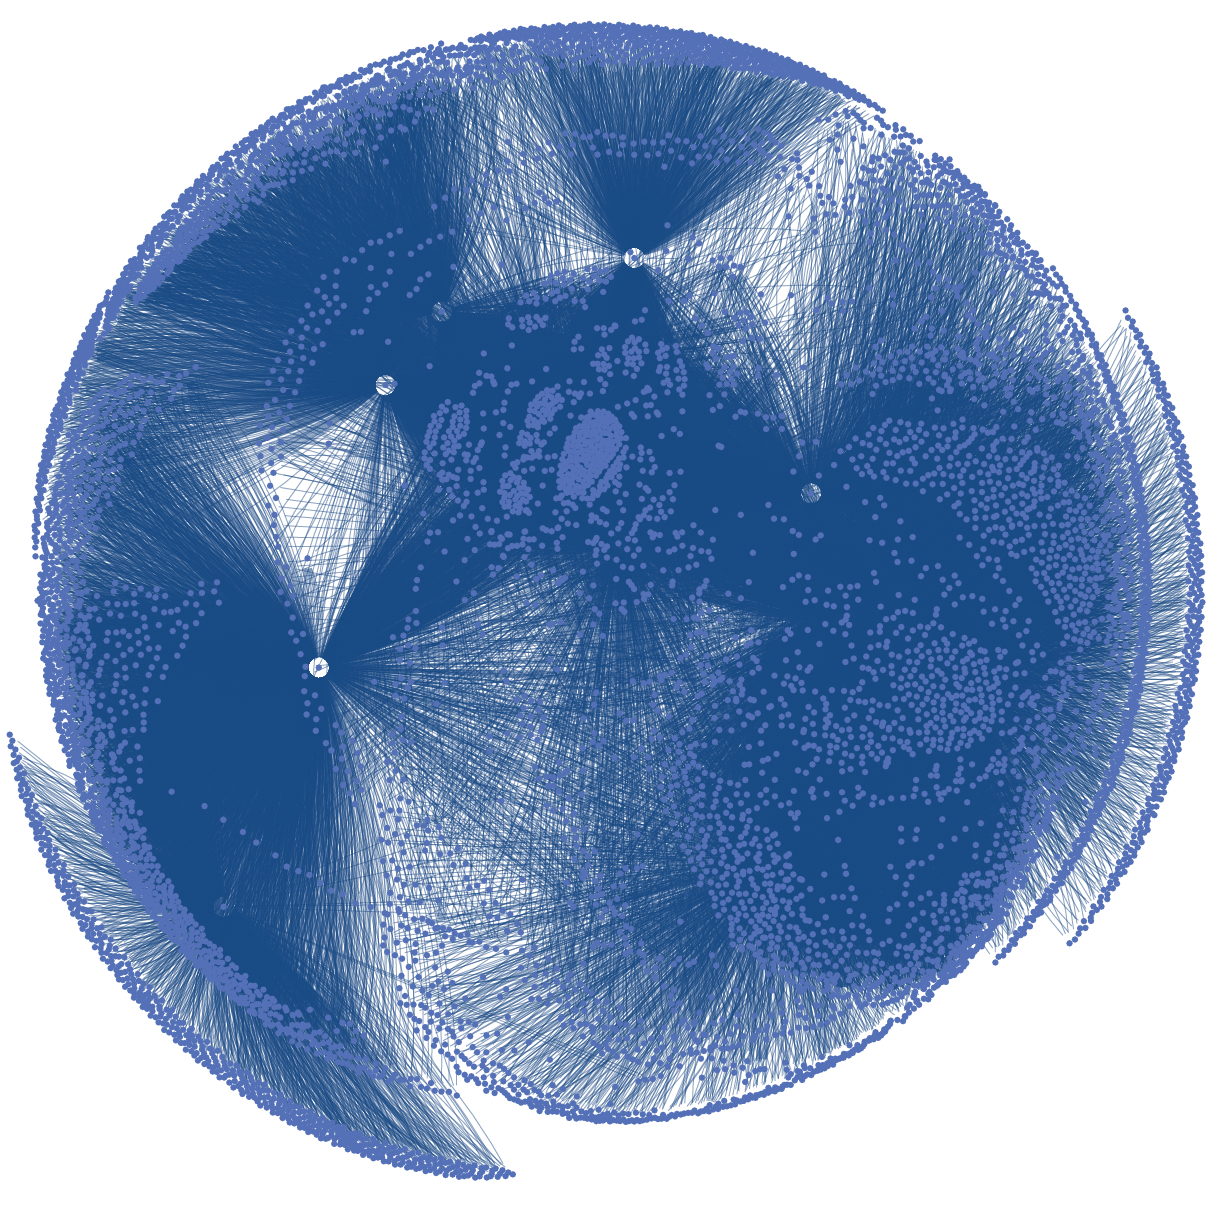
Networks or graphs are often too large or too dense to study without further partitioning and re-structuring. For example, networks of people who know each other or somehow linked to each other.
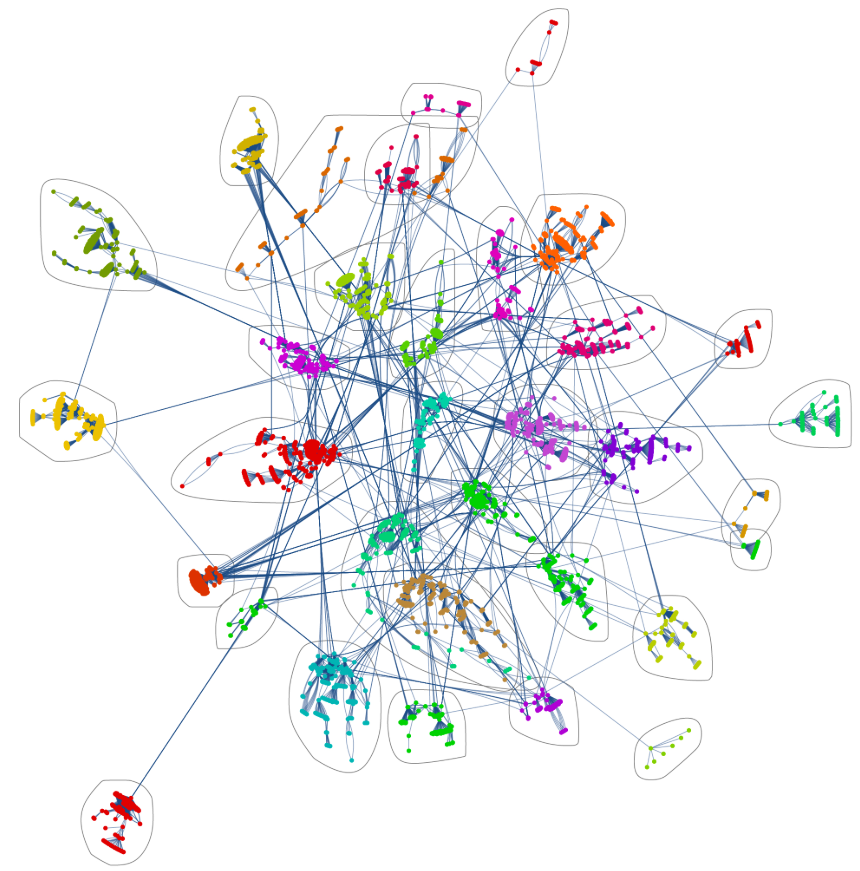
The following graph/network represents groups of executives who are linked to each other for a period of time, as specified in the Boardex report.
Community Structures are quite common in real networks. Social networks include community groups (the origin of the term, in fact) based on common location, interests, occupation, etc.
A very important reason that makes communities important is that they often have very different properties than the average properties of the networks. Thus, concentrating only on the average properties usually misses many important and interesting features inside the networks. For example, in a given social network, both gregarious and reticent groups might exist simultaneously.
The links (edges) below indicate that the executives know of each other or made a deliberate connection.
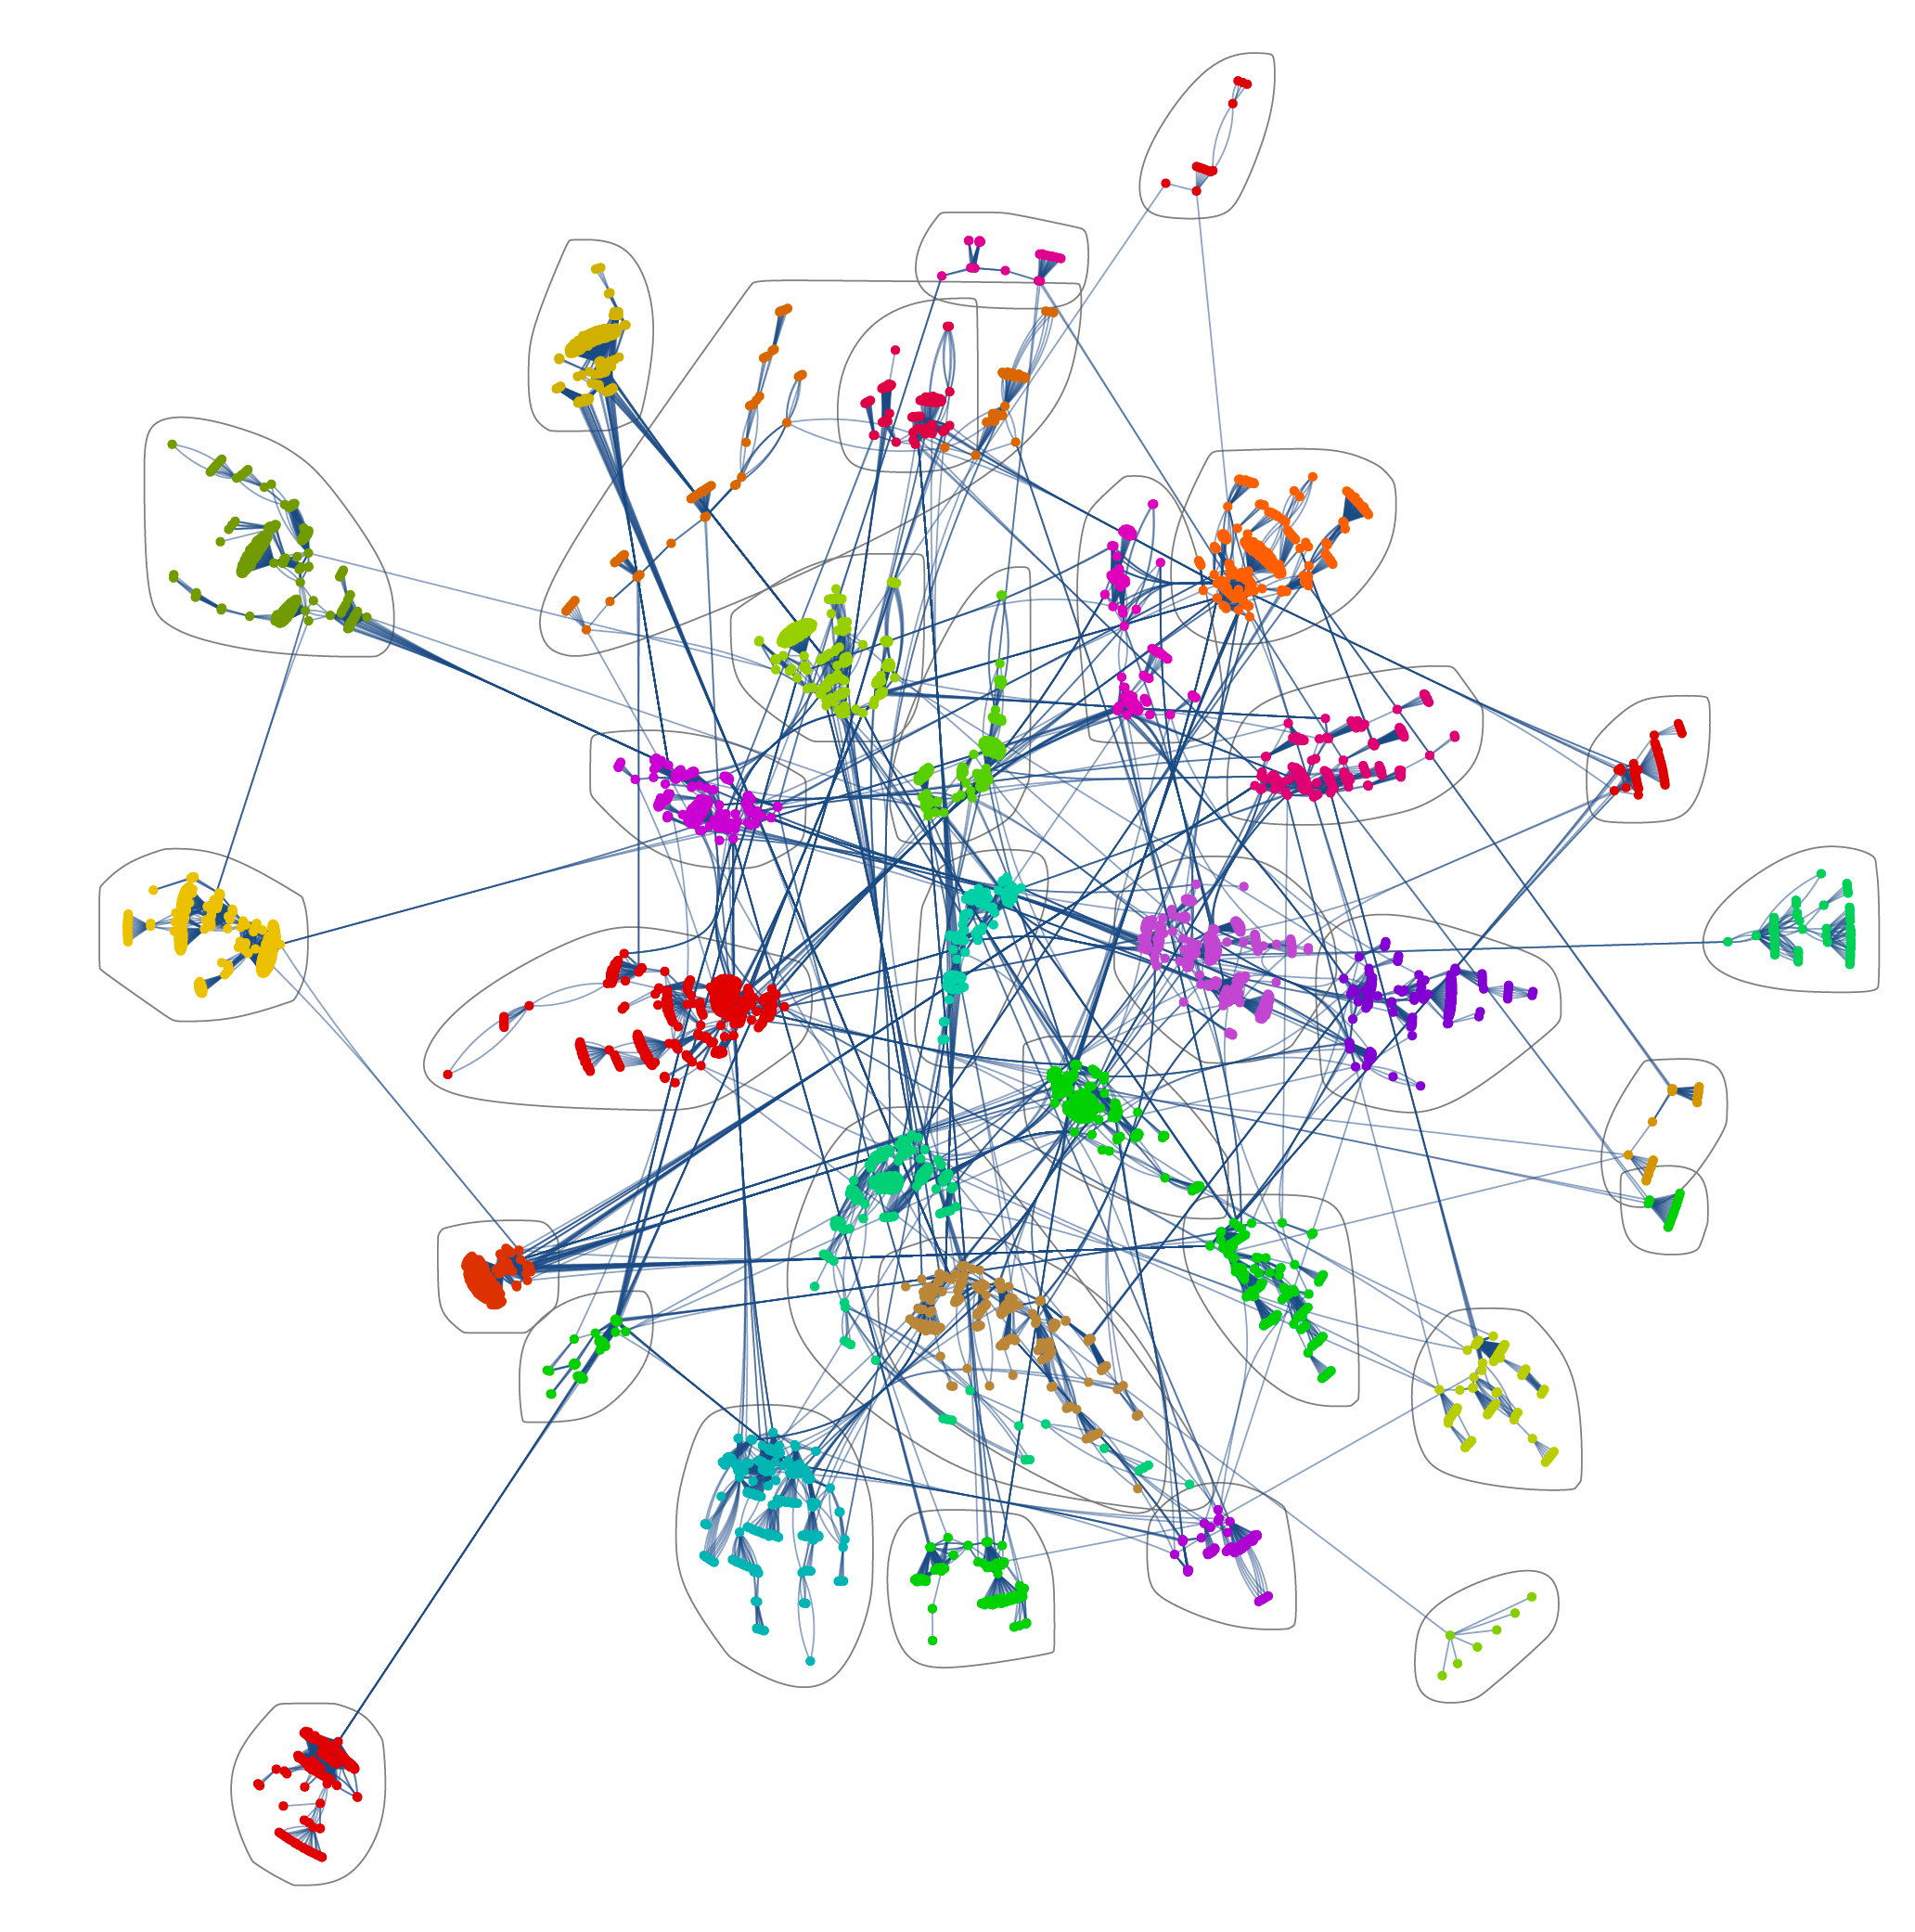
Each densely packed community bounded by a closing curve and differently coloured.
Each community reflects the fact that their member executives (coloured nodes within each community) are more familiar with each other than the rest of the network of executives.
An important application that community detection has found in network science is the prediction of missing links and the identification of false links in the network. During the measurement process, some links may not get observed for a number of reasons. Similarly, some links could falsely enter into the data because of the errors in the measurement. Both these cases are well handled by community detection algorithms since it allows one to assign the probability of existence of an edge between a given pair of nodes.
The nodes of the community graph could be textual data e.g. maintenance records.
Influencer: Information Dissemination
Given a Community graph e.g. Boardex executive links, one might want to conduct a campaign to spread information in the most expedient fashion.
For that matter it is important to simulate the propagation of information to search for the best Influencers.
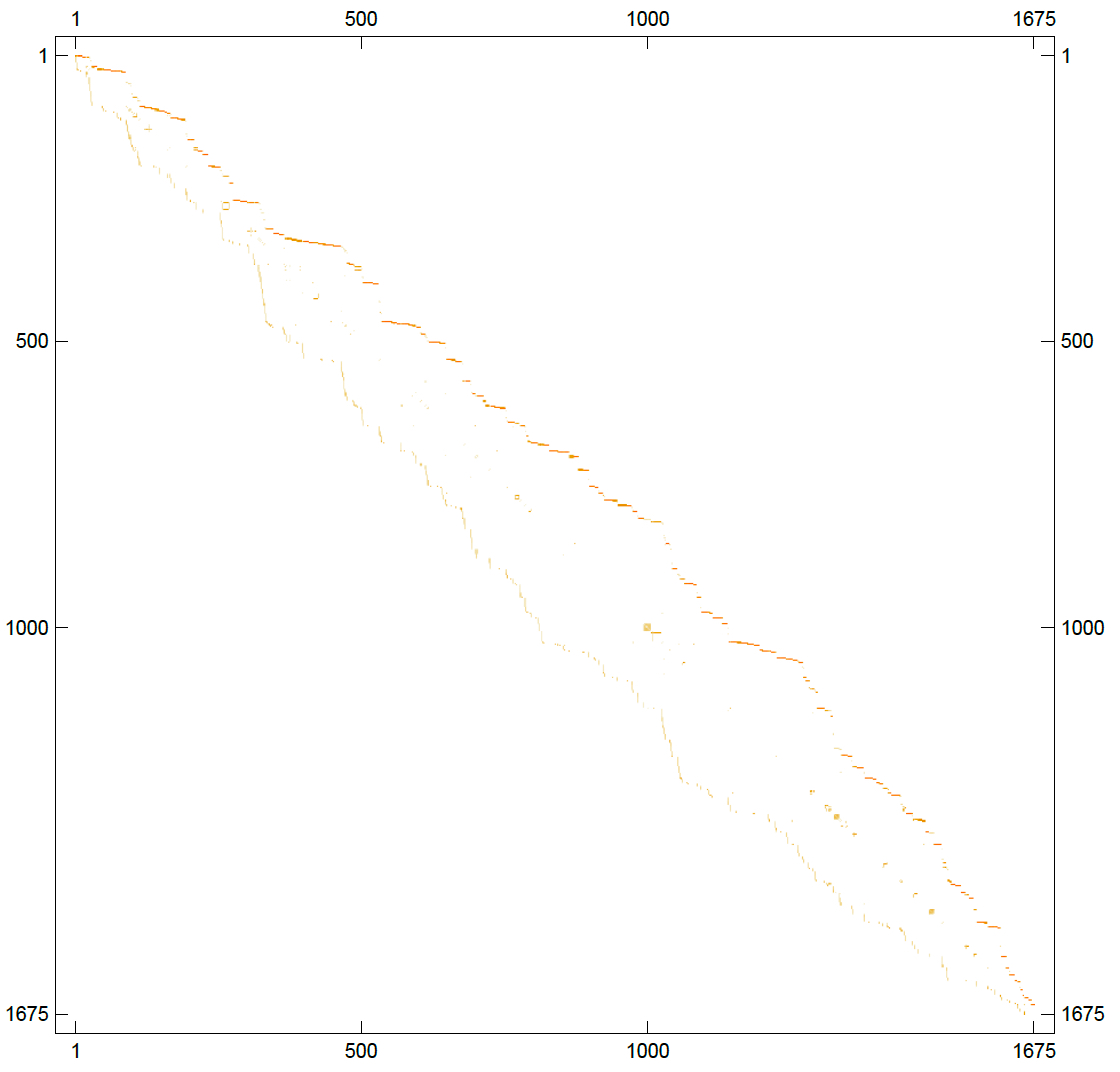
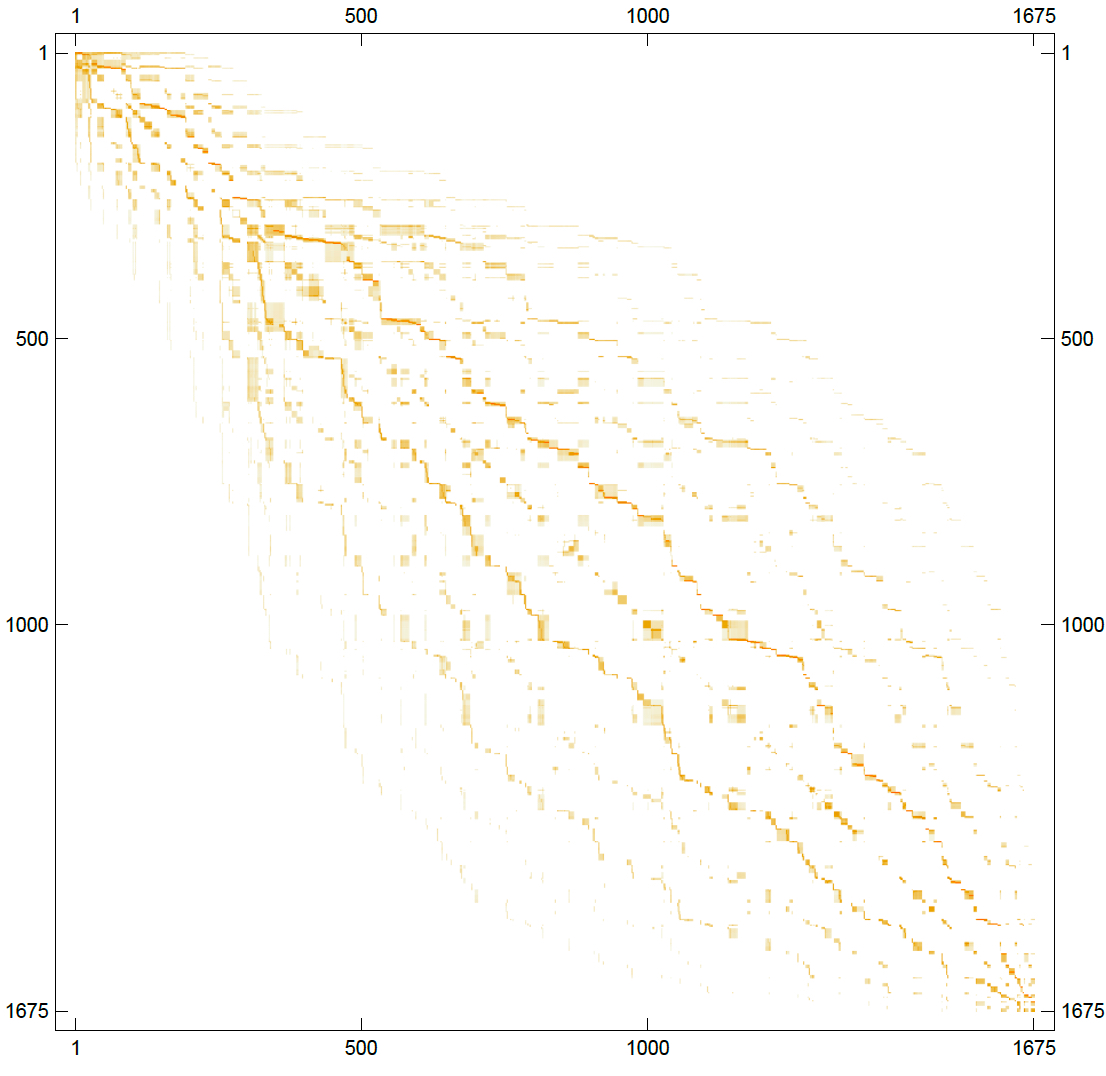
Each number from 1 to 1675 indicates an executive.
Each painted pixel (gold colour) indicates reach of information, the darker the colour the more probability of information reach.
This first diagram shows a short time after the start of the campaign how the information was propagated outwardly.
Remark: Originally graph had started as a diagonal line.
Many steps later on, the information has propagated far and wide from the diagonal.
Much later on, strong clusters of dark regions appear, thus indicating the information rich individuals.
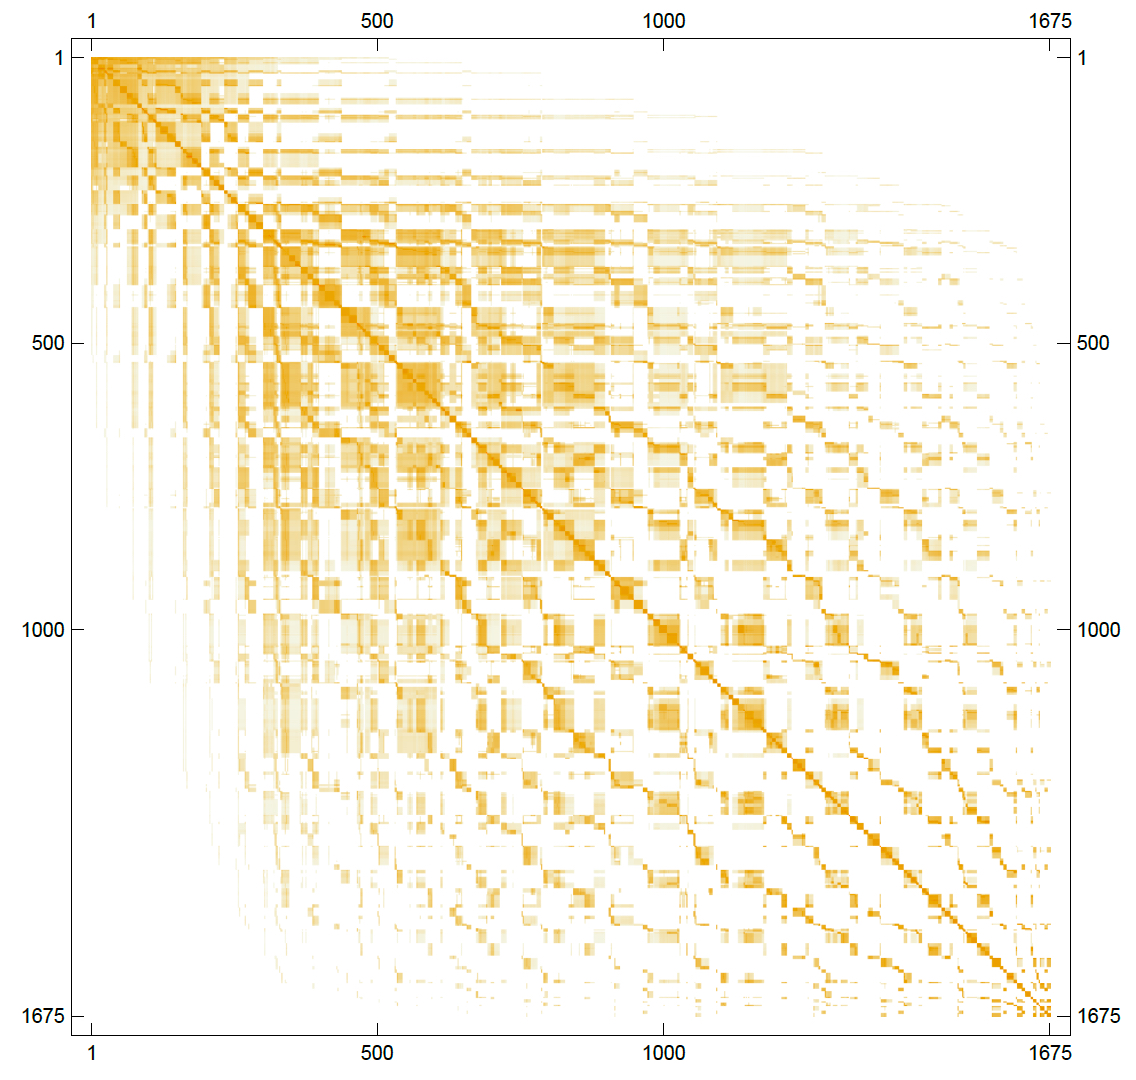
These clustered regions easily show where (who) the concentration of information propagation occurred and when.
Therefore a map of information flow is obtained.
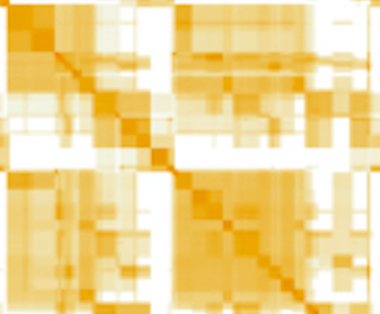
The campaign managers then have a simulation and resulting clusters as to the reach of the campaign; which individual is reached and when and which individual has information rich contacts (neighbours) .
The lighter or white regions indicate where (who) not to invest with informational resources since their reach is negligible.